A,beam,range,monitor,based,on,scintillator,and,multi-pixel,photon,counter,arrays,for,heavy,ions,therapy
时间:2023-05-30 13:15:13 来源:雅意学习网 本文已影响 人 
Wei Wang· Xiao-Xiao Yuan · Xiao-Hong Cai
Abstract Fast beam range measurements are required to maximize the time available for patient treatment, given that the beam range requires verification with respect to quality assurance to maintain accelerator commissioning standards and ensure patient safety. A novel beam range monitor based on a plastic scintillator and multi-pixel photon counter(MPPC)arrays is therefore proposed in this paper. The monitor was constructed using 128 plastic scintillator films with a thickness of 1 mm and an active area of 50 × 50 mm2. A customized MPPC array read the scintillation light of each film. The advantage of dividing the active detector volume into films is that it intercepts the particle beam and enables direct differential light yield measurement in each film, in addition to depth-light curve generation without the need for image analysis.A GEANT4 simulation, including scintillator quenching effects, was implemented, and the results revealed that Birks’law exhibited a slight little influence on the position of the beam range, only changing the shape and absolute normalization of the Bragg curve, which is appropriate for the calculation of the beam range using the depth-light curve.The performance of the monitor was evaluated using a heavy-ion medical machine in Wuwei City, Gansu Province, China. The beam range measurement accuracy of the monitor was 1 mm, and the maximum difference between the measured and reference ranges was less than 0.2%, thus indicating that the monitor can meet clinical carbon ion therapy requirements.
Keywords Beam range · Scintillator · Multi-pixel photon counter (MPPC) · Depth-light curve
Cancer (a malignant tumor) is one of the most fatal diseases. According to the statistics from the International Agency for Research on Cancer, approximately 70% of tumor patients require radiotherapy to achieve radical or palliative care [1].
The history of radiotherapy can be dated back to the discovery of X-rays by Wilhelm Ro¨ntgen in 1895, when X-rays were used to acquire diagnostic images and treat a variety of diseases, including malignant tumors. From the onward, many different types of radiation such as X-rays,electrons, protons, and heavy ions have been used in radiotherapy [2, 3]. Simultaneously, the primary principle of radiotherapy was clarified,namely,precise dose delivery to the tumor volume with minimal damage to healthy tissues, thereby reducing late-stage side effects [4].
Conventional X-ray and electron therapies are characterized by nearly exponential attenuation and absorption,which delivers maximum energy to a region near the entrance of the beam while depositing large amounts of energy at distances away from the tumor.This results in the absorption of a greater dose by normal tissue along the particle trajectory[5].The primary benefit of using protons and heavy ions in radiotherapy is due to their inverted dose distributions and a highly localized dose depositions. The energy loss of protons and heavy ions in matter is concentrated at the end of this range,thus resulting in a Bragg peak in the depth-dose distribution[6].The position of the Bragg peak can be shifted by adjusting the incident particle energy to focus on the tumor, thus reducing damage to healthy tissue [7].
For heavy ions,the plateau area before the Bragg peak is lower than that for protons;therefore,the deposited dose in normal tissues in front of the tumor is smaller. Furthermore, heavy ions have a higher linear energy transfer(LET), thus resulting in a relative biological effect that is greater than that of protons by a factor of approximately three thus,heavy-ion therapy is significantly more sensitive to ion range uncertainty [8]. As a result, the precise measurement of the beam range and accurate location of the Bragg peak of carbon ions are critical.
In current clinical practice, most range measurement techniques require reconstruction of the beam range from the peak position of the Bragg curve,which is obtained by measuring the deposited dose at different depths in an absorber [9, 10]. The standard method for determining the ion Bragg peak position is to measure the depth-dose curve by moving an ionization chamber immersed in a water tank along the beam path [11], which is time-consuming and impractical for real-time range monitoring. A multi-layer ionization chamber (MLIC), which is made of a stack of ionization chambers sandwiched between beam degrader plates (generally made of aluminum), can be used to improve the measurement efficiency [12]. However, the use of an aluminum degrader increases the measurement complexity, as it is not an inherently water-equivalent thickness. In addition, the MLIC is subject to dose-rate effects and requires recalibration when used outside the reference conditions.
In the absence of ideal instrumentation for heavy-ion beam range measurements, alternative detectors based on scintillators and digital cameras were developed [13].Scintillators have advantageous properties such as doserate independence, nearly water-equivalent density, and a mass stopping power similar to that of water,making them useful in particle therapy [14]. However, these devices share one feature: the fluorescent light of the scintillator is read out by a digital camera [15]. The reflection and refraction of the scintillator have a significant influence on the light spot and detection boundary judgment. Furthermore,due to color saturation,the relationship between light intensity and color brightness is not strictly linear, thus necessitating the correction of optical artifacts.
Given that the beam range requires verification with respect to quality assurance to maintain accelerator commissioning standards and thus ensure patient safety, fast beam range measurements are required. Hence, a novel beam-range monitoring system based on thin-film scintillators and multi-pixel photon counter (MPPC) arrays is under development at the Institute of Modern Physics,Chinese Academy of Science. Preliminary results of the evaluation of the prototype monitor are presented in this paper.The remainder of this paper is organized as follows.Section 2 discusses the physics of carbon-ion interactions with scintillators. Section 3 describes the structure and components of a range monitor. Section 4 presents the Monte Carlo simulation of the monitor.Section 5 describes the carbon ion irradiation experiments,and the conclusions is provided in Sect. 6.
The scintillator emits light after absorbing the high-energy particles. When high-energy ions collide with a scintillator, they decelerate and deposit energy, thus causing scintillator molecules to ionize and excite.Scintillation photons are emitted during the de-excitation process.
The average energy loss from ionization dE along the projectile path dz in the absorber is referred to as the stopping power, energy loss, or LET. The stopping power,which describes the slowing-down and energy deposition process of ions in the scintillator, can be calculated using the Bethe–Bloch formula [7]:

The incident ions gradually approach a rest state in the scintillator to the energy loss, and the total route length of the ions in the scintillator can be approximated as the integral of the inverse of the energy loss:

where E0is the beam energy.
In clinical practice, the beam range commonly refers to the point at which the distal fall-off of the Bragg peak(depth-dose curve or depth-light curve)approaches 80%of the peak value, thus indicating that the dosage has been reduced to 80% of its maximum value. The mean beam range is defined as the stopping depth R with deviation σR,which is the range straggling.Given that the energy loss is a statistical process, the statistical fluctuations of the energy loss in the large number of collisions of the slowing-down process cause the actual stopping depth to vary for different particles.These fluctuations are described by a semi-Gaussian distribution [7],and the deviation σRof the mean beam range is related to the variance σEof the energy loss as follows:

This indicates that with an increase in the monoenergetic radiation of the ion beam, the more precise the mean beam range.
The ratio of straggling width σRand mean beam range R can be expressed as follows:

where f is a slowly varying function depending on the absorber, and m is the incident particle mass [16]. For carbon ions stopped in water, the relative straggling σR/R is on the order of 10–2.
The light yield of an ideal scintillation material is proportional to the deposited energy. However, as expressed by Birks’law[17],the quenching effects suppress the light output, thus resulting in a nonlinear dependence between light output and dose deposition. The differential light output dL/dz can be approximated as the product of light output efficiency of a scintillator ∈and the energy loss dE/dz, divided by a quenching correction factor QCF:

where k is a quenching parameter;B is a material constant;the product kB is generally referred to as Birks’ constant,which is dependent on the ion type and scintillation material;and C is a second-order term constant that should be included for higher LET.
Birks’ law has been successfully applied to the measurement of the depth-light curve, which is defined as the differential light yield of the ions in the scintillator. Given that the energy deposited in each sheet dE/dz can be calculated from the depth-light curve,the depth-dose curve can be calibrated as follows [7]:

where D denotes the absorbed dose,which is defined as the absorbed energy in a volume divided by the volume mass;F is the beam fluence (unit cm-2); and ρ is the mass density of the scintillator. Given that the relationship between energy loss and dose is linear, the depth-energy loss curve is used to represent the relative depth-dose curve in the following section of this paper.
A schematic of the range monitor is shown in Fig. 1.Based on the layered design of an MLIC, the monitor was composed of a stack of thin scintillation films that intercepted the ion beam.
The MPPC chips were adhered to the front and back sides of the thin scintillation film within one scintillator interval using transparent glue. This interleaving arrangement ensured that the sensitive area of the MPPC covered the entire scintillator thickness. A layer of silicon optical gel was spread between the MPPC and scintillator to improve the optical coupling efficiency. Given that each scintillation film corresponded to an MPPC chip, the monitor directly measured the depth-light curve of an ion beam. To prevent ambient light, the entire detector was wrapped with black opaque tape, except for the beam entrance face. The configuration described above eliminated optical artifacts while allowing for a compact detector design.
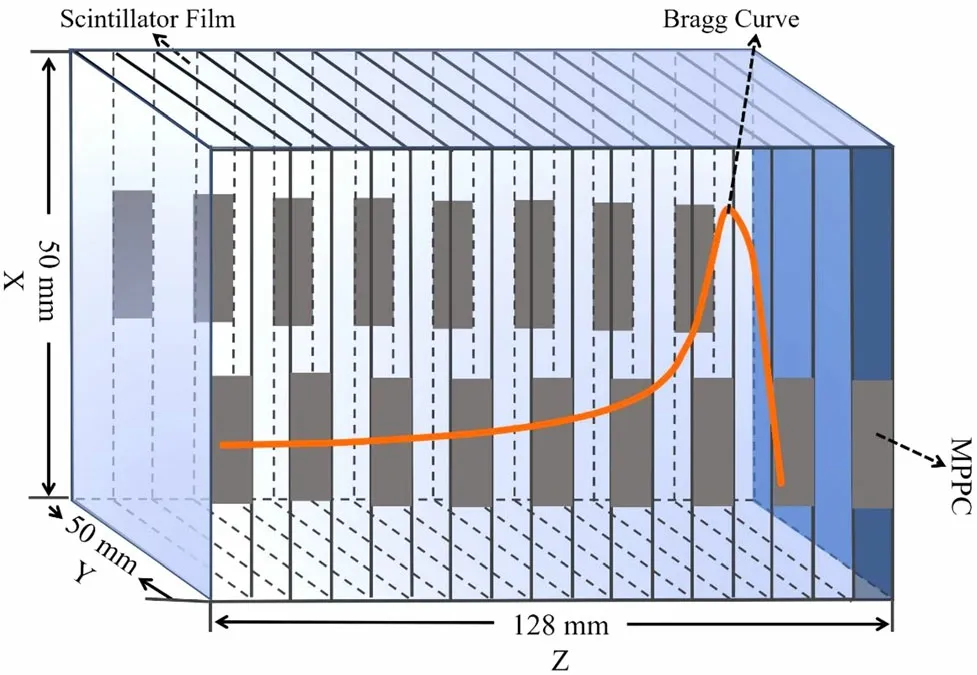
Fig. 1 (Color online) Sketch of the prototype range monitor with thin-film scintillator sheets and MPPC arrays. The ions beam enters from the left side and is completely absorbed in the stack of the thinfilm scintillator stack.The scintillation light is read out by an array of MPPCs, which is situated on the front and back sides of the stack within one film interval
The electric charge signals from the MPPC array were processed by 128 amplifiers, and an analog-to-digital converter (ADC) configured and read by a VME data acquisition system, which then transmitted data to a computer for further analysis. The remainder of this section presents further details on each monitoring component.
3.1 Scintillator stack
The scintillator stack consisted of 128 thin scintillation films with a transverse area of 50×50 mm2and thicknesses of 1 mm. The thickness of the film achieved a tradeoff between the position resolution of the depth-light curve,the mechanical strength of the scintillator films, and the commercial MPPC minimum size.The latter is significant for a potential future detector upgrade with a thinner scintillator and smaller MPPC. The transverse sheet size was selected such that the scintillator absorbed the majority of the dose from a conventional therapeutic carbon ion.
An EJ-200 plastic scintillator thin film with a maximum emission wavelength of 425 nm was used. The scintillator exhibited water-equivalent properties, with a mass density of 1.023 g/cm3, rise time of 0.9 ns, decay time of 2.1 ns,and pulse width of 2.5 ns. The typical scintillation efficiency was 104photons/MeV, thus indicating that the scintillation photons required an energy deposition of approximately 100 eV [18].
Optical decoupling between the films was required to attribute the differential light yield to a specific scintillation film.Hence,each film was painted with a 0.01-mm layer of matt black spray paint, with a 1×20 mm2longitudinal window left unpainted to allow for scintillation light to be emitted and read out concurrently by the MPPC.
It should be noted that achieving complete consistency between the thicknesses of each scintillation film is difficult. According to test report from the manufacturer, the average value of film thickness and the standard deviation are 0.99 ± 0.01 mm and 1.00 ± 0.01 mm, respectively,which correspond to the unpainted and painted thicknesses of the individual film. All packaged painted scintillators have a total thickness of is 128.10 ± 0.10 mm. We pumped a 24-h crude vacuum (1.3×10⁻³mbar) after assembling the detector,to prevent air bubbles between the scintillator layers, and applied maximum pressure without breaking the scintillator. A 1% variation in scintillator thickness was acceptable, given that the final depth-light curve was obtained through interpolation,which eliminated the thickness inconsistency.
Finally, the light output in each scintillation film was assigned to the depth at the center of the film. The advantage of segmenting the active detector volume into films is that it intercepts the particle beam and allows for direct differential light yield measurement in each film, in addition to the creation of depth-light curves without the need for image analysis.
3.2 MPPC array
The MPPC is a silicon photomultiplier (Si-PM) device composed of multiple avalanche photodiode (APD) pixels connected in parallel,and it operates in the Geiger mode.It is widely utilized in the field of weak light detection,while providing the high performance required for photon counting.
In this study, 128 customized Hamamatsu S13615-1025 N-X[19]were directly coupled with each scintillator film to detect the scintillation light output. The MPPC had 1×16 channels, each with an effective photosensitive area of 1 mm2. Each MPPC channel had 1584 pixels with a pitch of 25 μm and a fill factor of 47%. A single output node connected all pixels and channels in parallel, and the MPPC outputs were the sum of the outputs from all APD pixels.This pixelated structure allowed for the light field to be measured simply by counting the number of fired pixels.The parallel connection of pixels and channels with a common output provided a wide dynamic range spanning from the single-photon regime to high intensities.
The MPPC had a spectral response range of 300–900 nm, a peak sensitivity wavelength of 450 nm, a photon detection efficiency (PDE) of 25%, and a gain of 7×10⁵. The saturation incident power of the MPPC was approximately 200 nW(200×10–9J/s), which corresponds to a photon flux of approximately 450 photons/ns (photon wavelength of 450 nm, and energy of approximately 2.76 eV or 4.41×10⁻¹⁹J).
The input light signal was converted into the output photoelectron signal of the MPPC using the following relationship [20]:

where Q is the output charge, e is the electronic charge,M ~7×10⁵is the gain of the MPPC,S is the input phonon number, PDE ~25% is the photon detection efficiency at the peak-sensitivity wavelength. The single-photon gain eM·PDE was approximately 28 fC/photon, which corresponds to 1.75×10⁵photo-electrons per photon.
Using an energy loss value ranging from 1–20 MeV/mm and a scintillator thickness of 1 mm, we estimated that each scintillator produced 104and 2×10⁵photons. On the other hand, photon emission is isotropic and evenly distributed on a sphere with radius r. Due to the MPPC-sensitive area limitation, the actual number of detectable photons should be multiplied by a coefficient equal to the ratio of the MPPC-sensitive area to the spherical area.In this study,the sensitive area of the MPPC was 16 mm2and the sphere radius was r = 25 mm(half of the scintillator side length of the cross section). Therefore,the detectable photons ranged from 20–400 without considering the quenching effect of the scintillator,which was within the linear dynamic range of the MPPC.
Given that the light emission spectrum of the EJ-200 scintillator and PDE of the MPPC are wavelength-dependent, in that the rigorous calculating the detectable photon number requires a multiplication of the light yield and PDE at the same wavelength, followed by integration, which is insignificant and time consuming.Consequently,the above estimate was simplified using their optimal values. It should be noted that bias voltage and temperature have an influence on MPPC parameters such as the PDE, gain,and noise.The datasheet specifications for the MPPC were used to guide the applied bias voltage and environmental temperature.
3.3 Readout electronics
The amount of charge generated during photon detection was estimated as 0.56 pC and 11.2 pC,which correspond to 20 and 400 photons, respectively. This photocurrent requires conversion to voltage using a charge-sensitive amplifier with a gain range of 0.5–10 V/pC. A similar amplifier was previously described [21, 22]. In this study,128 amplifiers were connected to the output stage of the MPPCs using an FPC cable, and the input current signal was integrated with a shaping time of 200 ns and a full width of 1 μs.The gain of each amplifier could be adjusted according to the input signal and the dynamic range of the ADC.
An MADC-32 from Mesytec GmbH [23] was selected as the ADC due to its high resolution (up to 13-bit, 8 ks),speed (800-ns conversion time for 32 channels at 2 k resolution), and wide dynamic range (up to 10 V). The MADC-32 is a 32-channel peak-sensing ADC based on the VME bus, with each channel having an identical input terminal and individual threshold, thus allowing for independent bank operation and zero suppression. These configurations provide significantly stable offsets and lossless input-voltage collections.
The 128 input channels of the ADC were realized by daisy-chaining four MADC-32 modules on a VME crate.The ADC output data were transferred to a personal computer(PC)via a USB–VME bridge,and then processed using a data acquisition system (MVME). The detailed functions of the MVME are not covered in this paper, and the user guide [24] can be consulted for further information.
3.4 Test of the MPPC and readout electronics
A low-intensity blue-emitting LED with a wavelength of 460 nm was used to test the MPPC. The MPPC and amplifier were housed in a light-tight constant-temperature box with a 0.1-mm-diameter aperture, and the LED was mounted on it. The LED was driven by a Tektronix AFG31252 signal generator, which generated a light pulse with a width of 10 ns. The amplifier gain was set as 5 V/pC, and the ADC resolution was set as 2000.

Fig. 2 (Color online) A typical MPPC spectrum. a For low-intensity light, displaying up to 20 individual photon peaks corresponding to the number of MPPC fired pixels. The pink filled area represents the total number of incident photons. The blue curve is yielded by a multiple peak fit with a Gaussian distribution. The pedestal peak beneath one-photon peak should be subtracted from the total photon counts.b When the incident light intensity reaches a certain level,the independent peaks are indistinguishable,and the histogram as a whole displays a single Gaussian distribution
A typical pulse-height spectrum of an MPPC is shown in Fig. 2.As can be seen from Fig. 2a,the histogram exhibits distinct peaks that reflect the characteristics of the MPPC,where the peak position represents the most probable output value of the number of pixels firing simultaneously,and each peak can be approximated by a Gaussian distribution curve.When we changed the light intensity,the number of simultaneously fired pixels changed, and the peak moved.When the incident light intensity reached a certain level,the independent peaks were indistinguishable, and the histogram displayed a single Gaussian distribution, as shown in Fig. 2b. The integrated area of the histogram represents the total number of the incident photons.In this test case, Fig. 2a contains approximately 2.5 × 10³photons, and Fig. 2b contains approximately 3 × 10⁵photons that are incident on the MPPC.
Figure 2a reveals that a significant number of events occurred below the one-photon peak. This pedestal peak provided the noise contribution due to the delayed crosstalk and after-pulsing of the MPPC [25], which was subtracted from the total photon counts.
It should be noted that the bias voltage and temperature influence the MPPC parameters such as the PDE,gain,and noise.The datasheet specifications for the MPPC should be used to guide the applied bias voltage and environmental temperature.
4.1 physics-list settings
GEometry ANd tracking (GEANT4) is a Monte Carlo toolkit for simulating particle motion through matter, and the resulting interactions [26]. It provides a wide range of functionalities such as particle tracking and detector geometry, in addition to various physical models.
In this study,GEANTt4 was used to simulate the energy deposition and scintillation light output of the carbon ions in the EJ-200 plastic thin-film scintillator. The physics implemented in the simulation are listed here.In particular,G4EmStandardPhysics_option4 was used for the electromagnetic interaction modeling; and G4HadronElasticPhyscis and G4HadronPhysicsQGSP_BIC_HP were used to model the elastic nuclear interactions and inelastic nuclear de-excitation, respectively. It should be noted that G4IonBinaryCascadePhysics (binary cascade model for light ions), G4NeutronTrackingCut (kills neutrons through time of flight), G4EmExtraPhysics (electro-nuclear reactions, synchrotron radiation, and rare electromagnetic processes), and G4StoppingPhysics (nuclear capture at rest) were included, where G4Scintillation was used to simulate optical photons, in addition to GEANT4 standard particles. To obtain the depth-light curve and the relative depth-dose curve simultaneously, an instance of module G4EmSaturation was created to enable the creation of the number of photons according to Eqs. (5) and (6).
In the simulation, particle tracking was performed at intervals of 0.1 mm to ensure high-resolution range calculation.To minimize computation time,the production of secondary particles (carbon fragments) was not implemented; therefore, the fragments were not tracked.
4.2 Geometry, materials and beam parameters
The simulated geometry was simplified with respect to the mechanical setup described in Sect. 2.1. The EJ-200 plastic thin-film scintillator was modeled with the molecular formula (C6H4–CH3–CH2–CH)n, with a density of 1.023 g/cm3and a mean excitation energy of 64.7 eV.Birks’constant is a variable parameter with values ranging from 0 to 0.1 mm/MeV.
A12C6+beam of 106primary particles with energies ranging from 100 to 250 MeV/u entered the scintillator perpendicular to the stack at the center of the sheets. The starting point of the beam was set as 300 mm from the first scintillation film. The initial beam direction was along the z-axis, and the initial angular divergence of the beam was ignored.To simulate a realistic carbon pencil beam,a beam spot size of 10 mm FWHM along the x- and y-axes was selected. The initial energy spectrum of the beam was modeled as a Gaussian curve with an FWHM of 0.3% at 100 MeV/u, which decreased to 0.05% at 250 MeV/u.
4.3 Simulation results
Figure 3 presents an example of a simulated Bragg curve of 200 MeV/u12C6+ions in the monitor. The simulation curve(red line)is the immediate result of GEANT4 with a depth step of 0.1 mm. The integral curve (grey column) was obtained by filling a histogram with a bin width of 1 mm, which corresponds to the mechanical thickness of the scintillation film,with the cumulative sum of the differential energy loss of each 0.1 mm step.
The beam range denotes the depth distribution for which the ions stop,and the mean beam range indicates the depth of the stopped ions with the highest probability. In the simulation,the beam range was calculated by recording the z-axis intercept of the final step of carbon ions before rest,which had a simi-Gaussian distribution(blue curve)with a mean stopping depth of R =86.84 mm (blue dashed line)and straggling width of σR=0.29 mm(FWHM of the blue curve). The area of the beam range curve represents the total number of stopped ions.
The beam range of carbon ions with energies ranging from 100–250 MeV/u in water and the scintillator were simulated and illustrated in the upper part of Fig. 4. The error bars representing the range straggling were multiplied by a factor of 10 for simplicity.
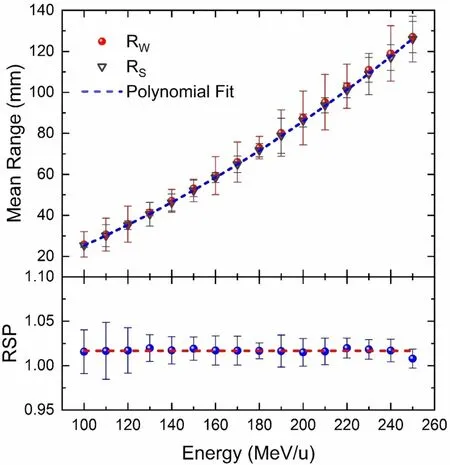
Fig. 4 (Color online) Comparison of the simulated mean range of carbon ions in water and the scintillator with energies ranging from 100 to 250 MeV/u. The error bars representing the range straggling were multiplied by a factor of 10, for simplicity. The RSP of the scintillator was calculated as 1.0167 ± 0.0027 using the equation RSP =Rw/Rs
Water is commonly used as a surrogate for human tissue in heavy-ion therapy due to its similar density, mass stopping power, chemical composition, and scattering power.It is convenient to convert the physical thickness of the scintillator into a water-equivalent length(WET) using the relative stopping power (RSP) equation.

where Rsand Rware the mean ranges of ions in the scintillator and water, respectively.
By calculating the ratio of Rw/Rs, we compared the simulated mean range of carbon ions with different energies in water and in the scintillator.As can be seen from the lower part of Fig. 4, the percentage residuals revealed that the difference between the two range simulations was less than 1.67%, and the RSP =Rw/Rswas 1.0167 ± 0.0027.The uncertainty of the RSP was obtained using the error transfer formula:
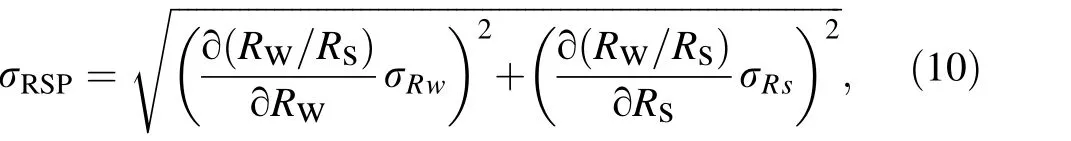
where σRsand σRware the ranges of straggling of the carbon ions in the scintillator and water, respectively.
According to Eq. (7), the percentage of dose converted to scintillation is dependent on the local energy deposition density, and the differential light output of a plastic scintillator dL/dz is a nonlinear function of the energy loss dE/dz, thus resulting in a nonlinear response in the scintillation light output.
Due to the lack of experimental kB data for EJ-200 measured with carbon ions, we calculated the quenching effect of different kB values on light output using proton data [27–29], and only included terms up to the first order in dE/dz, as shown in Fig. 5. As can be seen, with an increase in the constant kB, the light output suppression was more significant.

Fig.5 (Color online)The quenching effect at different kB constants,where ∈=104 photons/MeV and kB =0–0.1 mm/MeV. The calculation only includes the first order term of dE/dz
It should be mentioned that Birks’ constant is generally expressed in units of gMeV-1cm-2[27–30], and the unit for kB used in this study was mm/MeV. The reported values should be divided by the density of the scintillator to convert kB into mm/MeV units. Furthermore, due to the absence of experimental data of kB, in which hundreds of MeV/u carbon ions collided with the EJ-200 scintillator,the kB value was only utilized as a free parameter in this study. Therefore, only the dimensional transformation was implemented, and kB could be an arbitrary value. This simplicity of Birks’ model, which allows the quenching to be described with only one additional parameter,should be replaced by a more complex quenching model to accurately predict the quenching of high-energy carbon ions [31].
A set of depth-light curves of 200 MeV/u carbon ions12C6+with a kB value ranging from 0–0.1 mm/MeV are shown in Fig. 6. The curves were obtained by fitting the energy loss data with the nonlinear least squares method based on the Levenberg–Marquardt algorithm [32] and Eq. (5). The light output was inhibited in relation to the value of kB.
We recalculated the mean beam range using the depthlight curves at different kB values, where the range is defined as the position which the distal edge of the depthlight curves reaches 80% of the peak value. The mean range of the depth-light curves(magenta,orange,and olive dashed lines) did not coincide with the mean range of the energy loss curve(blue dashed line),i.e.,there were subtle variations. This is because the Levenberg–Marquardt algorithm is essentially an interpolation operation that smoothens the depth-light curves.

Fig. 6 (Color online) Depth-light curves of 200 MeV/u carbon ions 12C6+with a Birks’constant ranging from 0–0.1 mm/MeV.The light output is significantly inhibited in relation to the value of kB. The Birks’ constant has a slight influence on the position of the beam range, and modified the shape and absolute normalization of the Bragg curve
It should be noted that the beam ranges obtained from the depth-light curves were all within a tolerance of σR=0.29mm of the mean range R =86.84mm, which was obtained from the energy loss curve.Based on the findings,the Birks’constant had a slight influence on the position of the beam range, and only changed the shape and absolute normalization of the Bragg curve. It was therefore appropriate to calculate the beam range using the depth-light curve.
Carbon ion irradiation experiments were performed using a heavy ion medical machine (HIMM) in Wuwei City,Gansu Province,China[33].The HIMM consisted of two electron cyclotron resonance ion sources (ECRIS), a cyclotron injector, a synchrotron ring, and four treatment terminals. The12C5+beam generated by the ECRIS was pre-accelerated by the cyclotron to an energy of 7 MeV/u,and then injected into the synchrotron using the chargeexchange injection scheme, where the12C5+ions were stripped to12C6+by a stripping foil. The synchrotron ring was designed to accelerate12C6+ions with kinetic energies of up to 430 MeV/u and a flux of up to 1 × 10⁹particles per second (pps). Beam extraction from the synchrotron was performed using a technique called resonant slow extraction [34].
Using the in-built laser system and spirit level,the range monitor was positioned on a height-adjustable optical test bench and aligned with the beam axis.The first sheet of the scintillator stack was placed in the beam isocenter, at a distance of 300 mm away from the beam nozzle.
The depth-light curves (blue step line) for carbon ions with energies of 100 MeV/u,150 MeV/u,200 MeV/u,and 240 MeV/u,which were measured using the range monitor at a normalized beam intensity of 106pps,are presented in Fig. 7.For comparison,the relative depth-dose curves(red star) were measured in a water tank with the same beam parameters using an ionization chamber driven by a stepping motor.The GEANT4 simulation(black dashed line)is presented side-by-side for comparison. The number of output photons and GEANT4 simulation results under different incident energies were normalized according to the peak value of the corresponding depth-dose curve measured by the ionization chamber.
The mean beam range Ricobtained from the ionization chamber was selected as a metric to quantify the accuracy of the range Rsfrom the range monitor, and range Rsimfrom the GEANT4 simulation. The relative range difference is represented by(Rs-Ric)/Ricand(Rsim-Ric)/Ric,respectively. The results indicate that Rsand Rsimwere both consistent with Ric, with a maximum relative range difference of less than 0.2%, as shown in Fig. 8.

Fig. 7 (Color online) The depth-dose curves and relative depth-light curves of 100–240 MeV/u 12C6+measured by the ionization chamber and the range monitor, respectively. The number of output photons under different incident energies is normalized according to the peak value of the corresponding depth dose curve. The results agree well with the GEANT4 simulation (black dashed line)
To match the scintillator thickness, the step size of the stepping motor driving the ionization chamber was set as 1 mm. A smaller step was not used, given that the depthlight curve could be obtained through interpolation. Thus,the accuracy of Rswas assumed to be a minimum of 1 mm,which is the same as the range tolerance recommended by many therapy centers [35].

Fig.8 (Color online)The relative range difference between Rs,Rsim,and Ric. The results indicate that Rs and Rsim were both consistent with the Ric, with a maximum relative range difference of less than 0.2%
As previously stated, the quenching effects of the scintillator result in a nonlinear response in the scintillation light output. Using the dose data from the ionization chamber and the number of photons measured by the scintillator, we calibrated the differential light output dL/dz with the deposited energy dE/dz and calculated the quenching correction factor (QCF) of the EJ-200 scintillator.As can be seen in Fig. 9,the red dashed line indicates the relationship between dE/dz and the dL/dz when there was no quenching effect (kB =0), where dE/dz was normalized by the dose data with a beam fluence of 106/cm2and a water density of 1 g/cm3. The blue dashed line represents a nonlinear fit according to Eq. (6),which omits the second-order term. The light output undergoes a significant quenching process,which is consistent with Birks’law and the QCF ~1 +0.17·dE/dz with Birks’ constant kB =0.17.
Carbon ion therapy is a type of radiotherapy that can treat cancer while exposing less healthy tissues to radiation than traditional X-ray therapy.The range of the ion beam is the most important parameter in therapy, as it determines where the maximum dose is deposited.
This paper presents a unique beam-range monitoring system based on thin-film scintillators and MPPC arrays,which were developed at the Institute of Modern Physics,Chinese Academy of Science.

Fig.9 (Color online)The quenching correction factor of light output with deposited energy. The red dashed line indicates the relationship between dE/dz and the dL/dz when there is no quenching effect.The bule dashed line represents a nonlinear fit according to Eq. (6) that omitted the second-order term
The segmenting design of the monitor allowed for the MPPC to directly measure the differential light yield in each scintillator film and create depth-light curves without the need for image analysis. Hence, the fast range measurement of carbon ions was demonstrated.
The GEANT4 simulation demonstrates that the quenching effect of the scintillator had a slight influence on the position of the beam range,and only changed the shape and absolute normalization of the Bragg curve.The depthlight curve can be directly used to calculate the beam range.
The range monitor was tested using carbon ions with energies ranging from 100 to 240 MeV/u.The beam range measurement accuracy of the monitor was 1 mm, and the maximum relative range difference between the range monitor and ionization chamber was less than 0.2%, thus indicating that the monitor could meet the requirements of clinical carbon ion therapy.
Although the monitor was designed to measure the range of therapeutic carbon-ion beams, it could also be used for WET measurements of implants, patient range probing, and online range verification in particle therapy(proton or heavy ions). This monitor can be utilized in carbon ion therapy at HIMM to improve and speed up range quality assurance measurements, thus rendering particle therapy safer, increasing patient throughput while saving costs, and ultimately making particle therapy more affordable.
AcknowledgementsThe authors would like to acknowledge the operating crew of the HIMM facility for supplying carbon-ion beams.
Author contributionsAll authors contributed to the study conception and design. Material preparation, data collection and analysis were performed by Wei Wang,Xiao-Xiao Yuan and Xiao-Hong Cai.The first draft of the manuscript was written by Wei Wang, and all authors commented on previous versions of the manuscript. All authors read and approved the final manuscript.
推荐访问:based scintillator Multi